Litter impacts social and environmental values

Litter is consistently rated by the community as one of the biggest threats to waterways. Litter detracts from the community enjoyment of waterways. The presence of litter creates a perception that a place is not cared for by people. People associate litter with poor stream health and perceive waterways with no visible litter as healthy waterways.
Values impacted by litter
Amenity, recreation and community connection
The presence of litter impacts on the amenity of waterways, which in turn impacts the sense of community connection and the enjoyment gained through recreation along waterways.
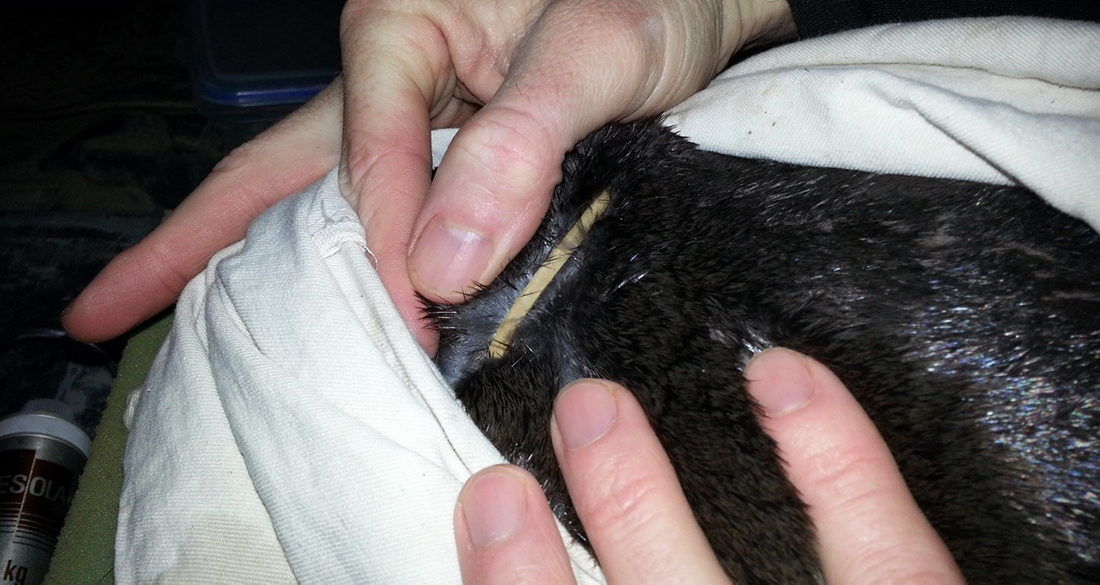
Platypus
Litter such as fishing line and hairbands poses a risk to platypus due to the possibility of entanglement which can lead to platypus drowning.
There is not a strong relationship between the presence of litter and the health of other environmental value such as fish and frogs in waterways. This is due to the litter in waterways often being relatively inert. Litter is a more significant problem for the environmental values when it reaches and settles in the bays.
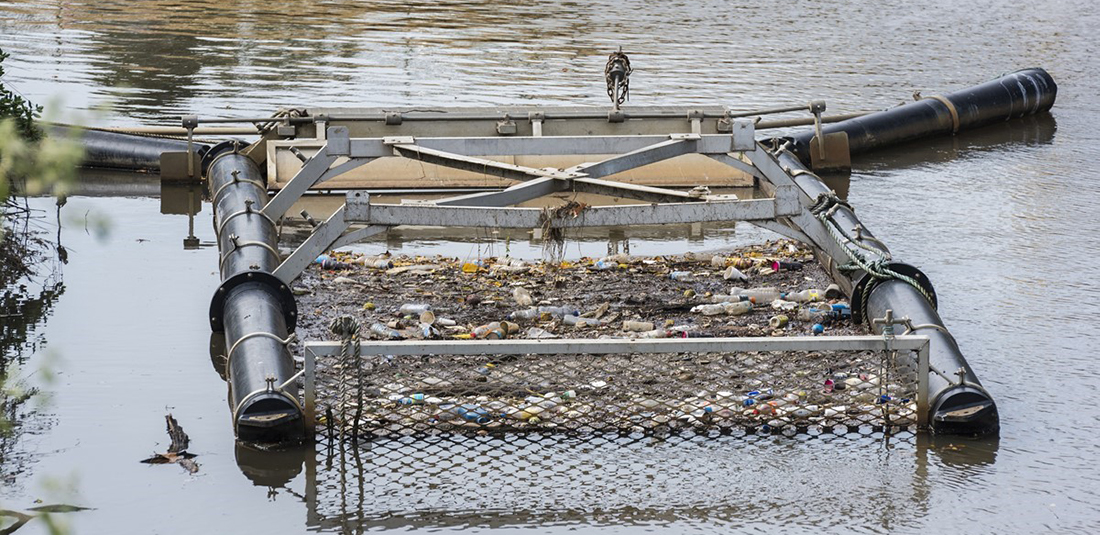
Litter is measured based on observations
Litter is based on observation, with many organisations and community groups coordinating litter collections and assessment. Standardised reporting on litter to support the collaborative sharing and use of the data is evolving.
Litter baseline and targets
2018 baseline: measured using the Clean Communities Assessment Tool (CCAT), and generalisation drawn from the data. The CCAT provides a systematic assessment of littering behaviour, litter and key features of public places.
2068 target: assumes that places where scores are currently assessed as ‘high’ (meaning prevalence of litter is low) have potential to maintain or improve the score to very high through increased investment in litter prevention initiatives.
Without additional effort to change urban drainage design and littering behaviour, it is projected that litter in waterways will increase as urban population increases. Where scores are currently assessed as high and there is likely to be significant urban growth, the current trajectory is for them to degrade to moderate.
Number of waterways in each catchment by litter absence score
Hover, click or tap (on mobile) the charts below to view more information.
Baseline and trajectories in Rivers
Actions to improve litter
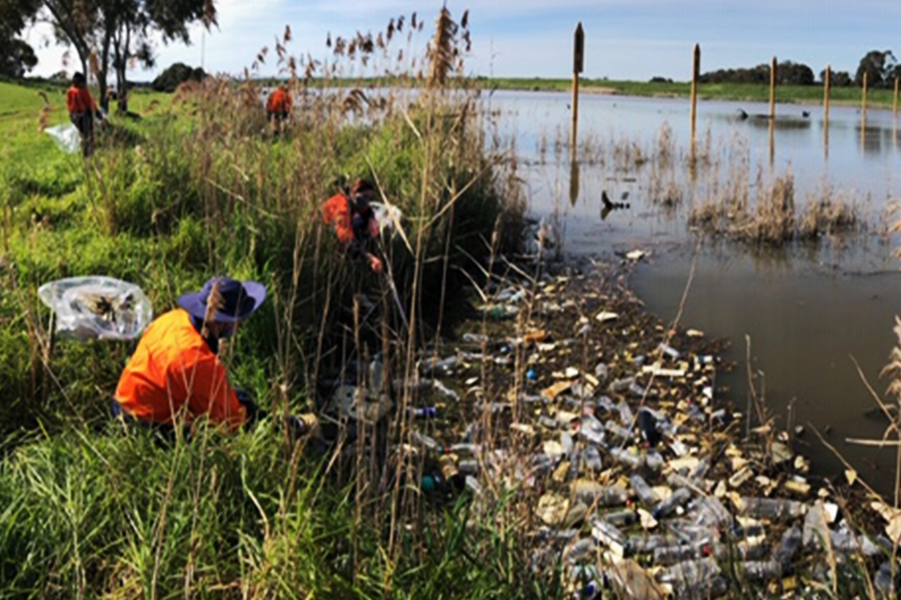
Litter is managed through behaviour change programs such as education and enforcement and through physical mechanisms such as street sweeping, litter traps and litter collection.
The strategy includes actions to reduce littering through raising community awareness and knowledge; development of infrastructure and use of enforcement; and ongoing improvement in the assessment of litter volumes and sources to inform prioritisation of these programs.
See regional performance objectives RPO-26 and RPO-27 in the Report Card for the litter related objectives of the Strategy.

2023 Case study: Collaboration is key — Tackling the tricky issue of litter together
Litter in waterways continues to be of great importance for our community. Not only is it unsightly and can entangle animals, it represents the impact that invisible pollutants in run-off can have on waterways.
2020 Case study: Litter Trackers - Understanding litter transport in Melbourne’s waterways
Litter is a significant problem in waterways and most of the sources of litter arise from our suburban streets. Litter tracking studies using plastic bottles with small GPS tracking devices inside collected data to show how far and how quickly litter travels through drains and waterways to the sea.